45% dos americanos consumiram maconha no último ano!


GALLUP
Story Highlights
- Percentage of those who have tried marijuana highest since 1969
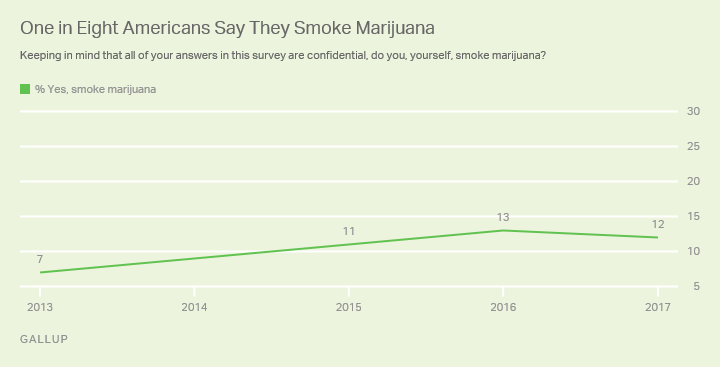
- One in eight currently smoke marijuana
- Younger, lower-income men more likely to smoke pot
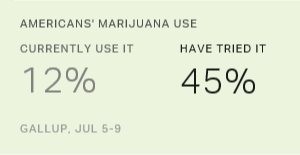
WASHINGTON, D.C. — As more U.S. states legalize marijuana use, 45% of Americans say they have tried marijuana at least once, a new high in Gallup’s trend since 1969.

These results are from Gallup’s July 5-9 poll on Americans’ consumption habits.
When Gallup first asked this question in 1969, only 4% said they had tried marijuana. The rise in use over the past five decades has paralleled the increasing support for legalization — last year, 60% said pot should be legal, a record high. Eight states allow recreational marijuana use, and these states comprise one-fifth of the U.S. population.
The increase in the percentage who have tried pot comes amid a possible federal crackdown on legal marijuana. Attorney General Jeff Sessions has initiated a task force studying links between violent crime and marijuana, and this body will reportedly release its findings by the end of July. The attorney general also has asked congressional leaders to undo restrictions on prosecuting medical marijuana providers, citing a “historic drug epidemic.”
Fewer Currently Smoke Marijuana Than Have Tried It
A separate question finds 12% of Americans saying they currently smoke marijuana, far less than those who say they have tried the drug. The percentage saying they smoke marijuana has nearly doubled since Gallup first asked this question in 2013, although there has been no meaningful increase over the past three years.

Young adults, men and those with household incomes of less than $30,000 per year are most likely to say they currently smoke marijuana. Thirteen percent of men say they smoke pot, compared with 7% of women. Eighteen percent of those aged 18 to 29 and 13% in the lowest income bracket say they currently smoke marijuana.
| Have tried marijuana | Smoke marijuana | |||||||||||||||||||||||||||||||||||||||||||||||||||||||||||||||||||||||||||||||||||||||||||||||||||
|---|---|---|---|---|---|---|---|---|---|---|---|---|---|---|---|---|---|---|---|---|---|---|---|---|---|---|---|---|---|---|---|---|---|---|---|---|---|---|---|---|---|---|---|---|---|---|---|---|---|---|---|---|---|---|---|---|---|---|---|---|---|---|---|---|---|---|---|---|---|---|---|---|---|---|---|---|---|---|---|---|---|---|---|---|---|---|---|---|---|---|---|---|---|---|---|---|---|---|---|---|
| % Yes | % Yes | |||||||||||||||||||||||||||||||||||||||||||||||||||||||||||||||||||||||||||||||||||||||||||||||||||
| Gender | ||||||||||||||||||||||||||||||||||||||||||||||||||||||||||||||||||||||||||||||||||||||||||||||||||||
| Men | 48 | 13 | ||||||||||||||||||||||||||||||||||||||||||||||||||||||||||||||||||||||||||||||||||||||||||||||||||
| Women | 35 | 7 | ||||||||||||||||||||||||||||||||||||||||||||||||||||||||||||||||||||||||||||||||||||||||||||||||||
| Age | ||||||||||||||||||||||||||||||||||||||||||||||||||||||||||||||||||||||||||||||||||||||||||||||||||||
| 18-29 | 38 | 18 | ||||||||||||||||||||||||||||||||||||||||||||||||||||||||||||||||||||||||||||||||||||||||||||||||||
| 30-49 | 51 | 10 | ||||||||||||||||||||||||||||||||||||||||||||||||||||||||||||||||||||||||||||||||||||||||||||||||||
| 50-64 | 49 | 8 | ||||||||||||||||||||||||||||||||||||||||||||||||||||||||||||||||||||||||||||||||||||||||||||||||||
| 65+ | 23 | 3 | ||||||||||||||||||||||||||||||||||||||||||||||||||||||||||||||||||||||||||||||||||||||||||||||||||
| Income | ||||||||||||||||||||||||||||||||||||||||||||||||||||||||||||||||||||||||||||||||||||||||||||||||||||
| <$30,000 | 42 | 13 | ||||||||||||||||||||||||||||||||||||||||||||||||||||||||||||||||||||||||||||||||||||||||||||||||||
| $30,000-$74,999 | 42 | 10 | ||||||||||||||||||||||||||||||||||||||||||||||||||||||||||||||||||||||||||||||||||||||||||||||||||
| $75,000+ | 44 | 9 | ||||||||||||||||||||||||||||||||||||||||||||||||||||||||||||||||||||||||||||||||||||||||||||||||||
| Based on aggregated data from July 10-14, 2013; July 8-12, 2015; July 13-17, 2016; and July 5-9, 2017 | ||||||||||||||||||||||||||||||||||||||||||||||||||||||||||||||||||||||||||||||||||||||||||||||||||||
| Gallup | ||||||||||||||||||||||||||||||||||||||||||||||||||||||||||||||||||||||||||||||||||||||||||||||||||||
Current marijuana usage trends downward the older one gets. But the age patterns differ when looking at lifetime usage. Those in the 30-to-49 age range (51%) are most likely to have tried the drug, followed closely by those aged 50 to 64 (49%). This suggests that marijuana was more popular among Generation X and baby boomers, who probably tried it when they were younger, than it is among millennials.
Whatever their reasons, it’s clear that many adults in the 30-to-64 age range have tried marijuana at some point, although they don’t currently smoke it. Meanwhile, fewer younger Americans have tried pot, but more of them currently smoke it.
Bottom Line
With 29 U.S. states allowing medical marijuana use, and eight allowing recreational use, legal cannabis is taking hold in American society.
There may be obstacles to marijuana becoming fully “accepted” in the United States. Attorney General Sessions appears to be cracking down on marijuana use, and driving under the influence of pot continues to be a concern for many. Despite legal hurdles, however, a record-high percentage of Americans say they have tried marijuana.
Smoking pot is still not as prevalent as cigarette smoking in the U.S., at 17%, but current marijuana usage is about as high as it has been. If more states legalize the drug, regular usage — or at least experimenting with marijuana — could rise. Legality may confer a certain societal acceptance of the drug. Sessions’ hopes to prosecute state-level marijuana crimes may prove to be a hindrance, but it is unlikely this multibillion-dollar industry will be stopped anytime soon.
Historical data are available in Gallup Analytics.
Survey Methods
Results for this Gallup poll are based on telephone interviews conducted July 5-9, 2017, with a random sample of 1,021 adults, aged 18 and older, living in all 50 U.S. states and the District of Columbia. The two questions reported here are based on half samples of approximately 500 adults each. For results based on these samples of national adults, the margin of sampling error is ±5 percentage points at the 95% confidence level. All reported margins of sampling error include computed design effects for weighting.
Each sampl
e of national adults includes a minimum quota of 70% cellphone respondents and 30% landline respondents, with additional minimum quotas by time zone within region. Landline and cellular telephone numbers are selected using random-digit-dial methods.
View survey methodology, complete question responses and trends.
Learn more about how the Gallup Poll Social Series works.


